Graphs
Types of graphs
Use the Graphs\Legacy Dialogs menu to create different types of graphs:
- Histograms: display the distribution of one continuous variable. They provide information about the shape of the distribution of scores.
- Bar graphs: display the number of cases in particular categories, or the score on a continuous variable for different categories.
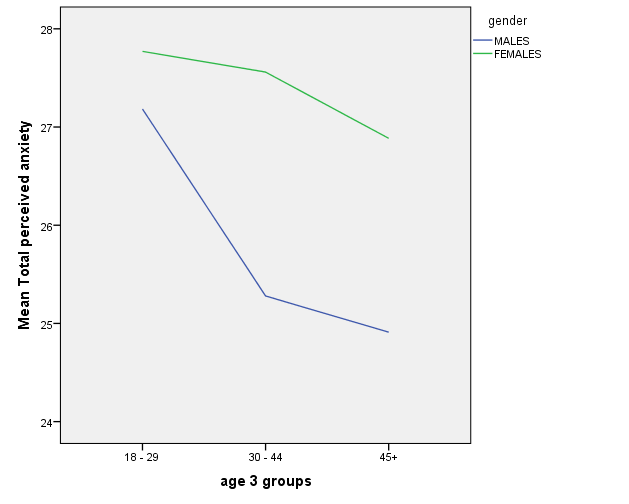
- Line graphs: display mean scores of a continuous variable across different categories.
- Scatterplots: used to examine the relationship between two continuous variables
Histograms
- Click on Graphs\Legacy Dialogs\Histogram
- Move your variable of interest into the Variable box
- An additional variable in the Panel by section will generate separate histograms for different groups.
- Click OK

Reprint Courtesy of International Business Machines Corporation, © International Business Machines Corporation. SPSS Inc. was acquired by IBM in October, 2009.
Bar graphs
- Click on Graphs\Legacy Dialogs\Bar\Clustered
- In the Data in chart area section, click on Summaries for groups of cases. Click on Define
- In the Bars Represent box, click on Other Statistic (e.g. mean)
- Click on the continuous variable you are interested in
- Move your first categorical variables into the Category axis box
- Move another categorical variable into the Define Clusters by box
- Click on Options\Display error bars if you wish to display them
- Click Continue and OK

Reprint Courtesy of International Business Machines Corporation, © International Business Machines Corporation. SPSS Inc. was acquired by IBM in October, 2009.
Line graphs
- Click on Graphs\Legacy Dialogs\Line
- Click on Multiple. In the Data in Chart Are section, click on Summaries for groups of cases. Click on Define
- In the Lines represent box, click on Other Statistic. Click on the continuous variable you are interested in
- Move your first categorical variable into the Category Axis box
- Move another categorical variable into the Define Lines by box
- Click on Options\Display error bars if you wish to display this.
- Click OK
Reprint Courtesy of International Business Machines Corporation, © International Business Machines Corporation. SPSS Inc. was acquired by IBM in October, 2009.
Scatterplots
- Click on Graphs\Legacy Dialogs\Scatter\dot
- Click on Simple Scatter and then Define
- Move your first variable, usually the dependent variable, into the box Y axis
- Move your other variable into the box X axis
- You can also use other categorical variable to mark each of the points by moving this variable into the Set Markers by box
- Move the ID variable in the Label Cases by box
- Click OK

Reprint Courtesy of International Business Machines Corporation, © International Business Machines Corporation. SPSS Inc. was acquired by IBM in October, 2009.