Measures of central tendency
Descriptive statistics: measures of central tendency
Obtaining descriptive statistics often involves using a few numbers to summarise data. There are two aspects involved in using descriptive statistics:
- determining where the centre of the distribution is located (measures of central tendency) and
- determining how much the scores in the distribution vary from one another (measures of variability).
Mean, mode and median are measures of central tendency (that is, the centre or middle of a set of data) and provide a single representative or typical value in a distribution. This section covers the measures of central tendency employed in descriptive statistics, how to compute them, and the main differences between them.
Mean, mode and median
Mean
The arithmetic mean is the most common measure of central tendency. It is computed by summing all the scores (sigma or Σ) and dividing by the number of scores (N):

Where X is the mean, ∑x is the addition or summation of all scores, and N is the number of cases.
- Example of calculating mean with formula:
Given the scores of first year students in a Statistics test, calculate the mean.
10 5 9 8 6 5 9 8 7 6 5 6
1. To calculate the mean, first add all scores; that is, 10+5+9+8++6+5+9+8+7+6+5+6= 84
2. Then divide the result by the number of cases (the number of scores): 12
3.
Applying the formula:
X= 84/12= 7
- Example of calculating the mean using a frequency table.
In this example, you are given a table of frequencies of the scores obtained in a Statistics test. The column on the left gives you test scores, and the column on the right the frequency (how many students obtained that score).
|
X (score) |
Frequency |
|
10 |
1 |
|
5 |
3 |
|
8 |
2 |
|
2 |
5 |
|
4 |
5 |
1. First, multiply each score by its frequency to calculate the sum of all scores:
10X1+5x3+8x2+2x5+4X5= 71
2. Then divide by the number of scores, which is the sum of all the frequencies: 1+3+2+5+5= 16
3. Applying the formula: 71/16= 4.43
The mean is sensitive to outliers (that is, unusually large or small observations). A 5% trimmed mean is calculated when there are outliers in the distribution, as it calculates the mean of the distribution when the top and bottom 5% scores are removed.
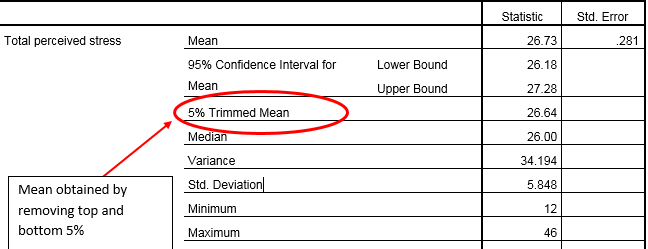
In this example, the 5% trimmed mean and the arithmetic mean are very similar. Thus, there are no extreme scores or outliers in this distribution that may be affecting the mean.
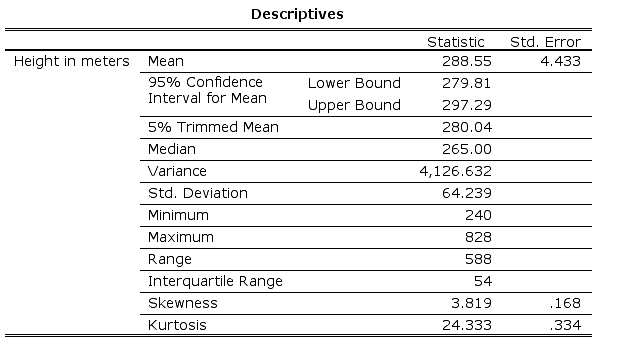
In this example, the 5% trimmed mean is different from the arithmetic mean. This implies that there are outliers in the distribution.
Mode
The mode is the value with the largest frequency in a table. In a histogram, it would represent the highest point or peak of the distribution. For example, if these were the scores of first year students in a Statistics test:
10 5 9 8 6 5 9 8 7 6 5 6
The mode is 6- this is the most frequent score.
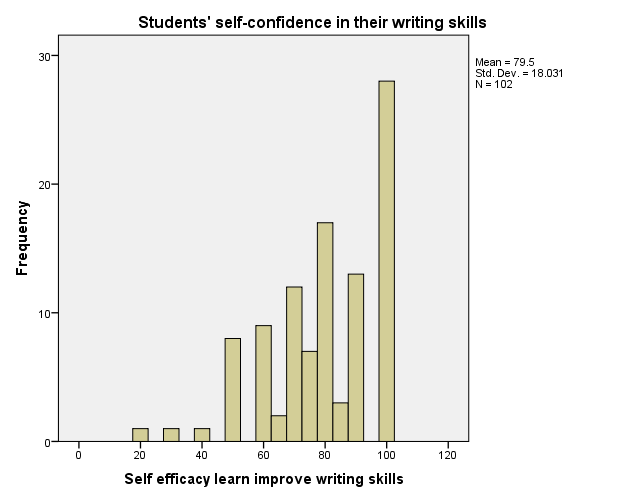
This histogram represents students’ self-confidence in their writing skills. The x axis represents scores (from 0 to 120) and the y axis the frequencies. In this example, the mode- value with the largest frequency in the histogram- is 100.
Median
The median is the middle value in a distribution. It is the point at which half of the scores are above, and half of the scores are below. It is not affected by outliers, so the median is preferred as a measure of central tendency when a distribution has extreme scores.
To calculate the median, values are sorted from lowest to highest. When there is an odd number of scores, the median is simply the middle score. When there is an even number of numbers, the median is the mean of the two middle numbers.
- Example: these are the scores obtained by first year students in a Statistics test:
10 5 9 8 6 5 9 8 7 6 5 6
1. First, values are sorted from lowest to highest:
5 5 5 6 6 6 7 8 8 9 9 10
2. We have an even number of scores; thus, the median is the mean of the two middle numbers:
6+7/2= 6.5
The median is 6.5
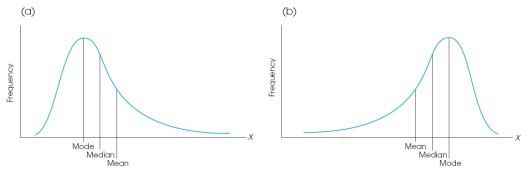
Symmetric and asymmetric distributions
For symmetrical distributions such as the one depicted below, the mean, median and mode are equal.
Differences among measures of central tendency occur with skewed distributions; that is, distributions that are not symmetrical. In the examples below,
a) is skewed to the right (more scores are on the lower end than on the higher end),
b) is skewed to the left (more scores are on the higher end than on the lower end).
In these cases, the mean is clearly not representative of the distribution. So the median is a better measure of the central tendency. Extreme scores strongly affect the mean, but not the median.
Activity 1. Find mean, mode and median
Statistical symbols used on this page
∑ - or sigma is Summation or the Addition of a sequence of numbers; that is, their sum or total.
N- number of cases
X- score