Probability and the normal distribution
Standard normal distribution and probability
Standard normal distribution
Normal distributions do not necessarily have the same means and standard deviations. Each data set or distribution of scores will have their own mean, standard deviation and shape - even when they follow a normal distribution.
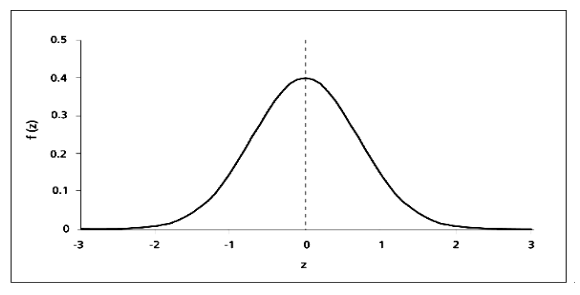
A normal distribution with a mean of 0 (u=0) and a standard deviation of 1 (o= 1) is known a standard normal distribution or a Z-distribution.
- The standard normal distribution (graph below) is a mathematical-or theoretical distribution that is frequently used by researchers to assess whether the distributions of the variables they are studying approximately follow a normal curve.
- Every score in a normally distributed data set has an equivalent score in the standard normal distribution. This means that the standard normal distribution can be used to calculate the exact percentage of scores between any two points on the normal curve.
- Statisticians have worked out tables for the standard normal curve that give the percentage of scores between any two points. In order to be able to use this table, scores need to be converted into Z scores.
Raw and Z scores
- Raw scores are the original scores that are a direct result of the measurement. However, they do not provide information about the position of that score in the distribution. For example, a score of 5 on an exam does not indicate how well a student performed in relation to his/her classmates.
- Z-scores (also called Standard scores) are transformed raw scores used to compare with the normal distribution.
Z-scores describe the exact location of every score in a distribution, for example:
- Whether the score is above or below the mean. Positive values indicate scores above the mean; negative values indicate scores below the mean.
What the distance between the score and the mean is in terms of the number of standard deviations. For example: a Z-score of 1.0 is one standard deviation above the mean; a Z-score of -2.5 is two and a half standard deviations below the mean. A Z-score of 0 will represent the mean of the distribution.
Calculating Z scores
A value from any normal distribution can be transformed into its corresponding value on a standard normal distribution using the formula:

Where x is the standardised value- or value on the standard normal distribution, x is the value on the original distribution, µ is the mean of the original distribution, and o is the standard deviation of the original distribution.
To calculate a Z-score, the mean and standard deviation are needed.
For example, if the mean of a normal distribution of class test scores is 50, and the standard deviation is 10, to calculate the Z-score for 26 the formula is applied:
Z = 26-50 = -2.4
10
The Z-score of a raw score of 26, in this given distribution, is -2.4 (negative sign means that the score is below the mean).
Transforming a Z-score back into raw score
Additionally, a Z-score can be transformed into a raw score by:
- Determining the deviation score by multiplying the Z-score by the standard deviation, then
- Determining the raw score by adding the mean to the deviation score.
In the example above, the raw score -2.4 can be transformed back into a raw score by:
- Multiplying the Z-score by the standard deviation (shown above as 10): -2.4 x 10= -24, and
- Adding this deviation score to the mean: -24 + 50= 26
Activity 1: How to calculate Z scores
Standard normal curve table
The standard normal curve table is used to calculate the precise percentage of scores between the mean (Z-score of 0) and any other Z-score. It can be used to determine:
- the proportion of scores above or below a particular Z-score,
- the proportion of scores between the mean and a particular Z-score, and
- the proportion of scores between two Z-scores.
The standard normal curve table is used:
- by converting raw scores to Z-scores then finding the probabilities, and
- to determine a Z score for a particular proportion of scores under the normal curve.
Calculating percentage of scores above or below a Z-score
Summary of Steps for determining percentage above or below Z-score:
- Convert raw score to Z-score (if needed)
- Draw a normal curve: indicate where the Z-score falls and shade the area you are trying to find.
- Use the table to find percentage to the left of the Z-score. If we need to find a percentage to the right of the Z-score, or between two Z-scores, we will have to do some extra calculations (see examples and activities in next tab)
- Standard normal curve table This is an example of standard normal curve table
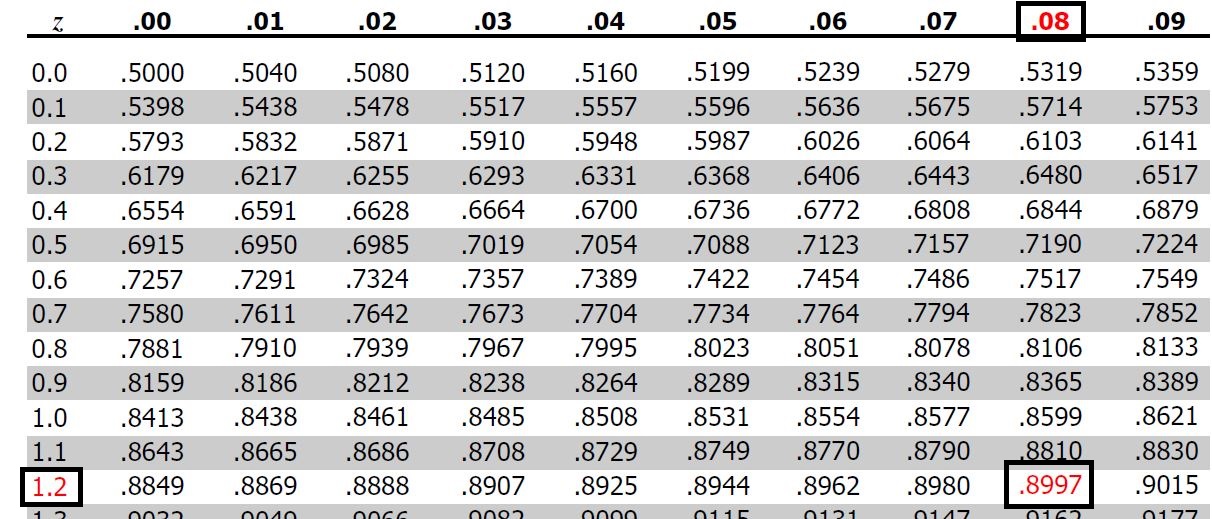
There are different versions of the standard normal curve table. In this version, the Z column contains values of the standard normal distribution; the second column contains the area below Z. Since the distribution has a mean of 0 and a standard deviation of 1, the Z column is equal to the number of standard deviations below (or above) the mean. For example:
- A Z-score of 2.5 represents a value of 2.5 standard deviations above the mean. The area to the left of a Z value of 2.5 is 0.9938

How to use a standard normal curve table
Once the scores of a distribution have been converted into standard or Z-scores, a normal distribution table can be used to calculate percentages and probabilities. Since the normal distribution is a continuous distribution, the probability that X is greater than or less than a particular value can be found.
A normal curve table gives the precise percentage of scores between the mean (Z-score = 0) and any other Z score. The normal curve table can be used to:
- Calculate the proportion of scores above or below a particular Z-score
- Calculate the proportion of scores between the mean and a particular Z-score
- Calculate the proportion of scores between two Z-scores
The table gives the proportion to the left of a chosen Z-value of up to 2 decimal places. To read the table, find the Z score in the left column Z. If your Z score contains decimals, use the columns to the right. For example, if you are looking for a Z score of 0.75, you will look at the intersection of 0.7 (Z column) and the column 0.05 (0.7 + 0.05= 0.75).
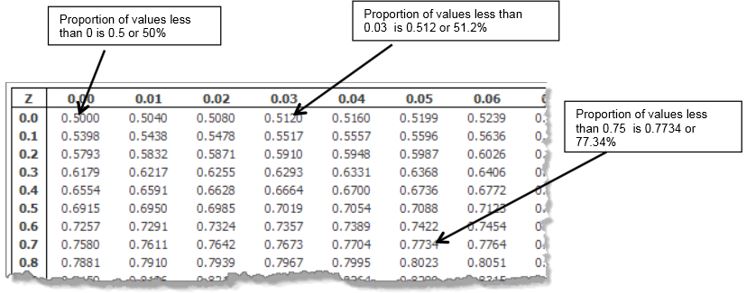
To obtain the probabilities, simply multiply the percentage by 100. E.g. 0.7734 would be expressed as 77.34%.
Example 1: Finding the percentage of values to the left of a Z score
In a standard normal distribution, what percentage of values will be less than 1.28?
1. Draw a diagram: you are looking for the percentage of the graph to the left of 1.28.

2. Use the standard normal table to find the value to the left of 1.28.
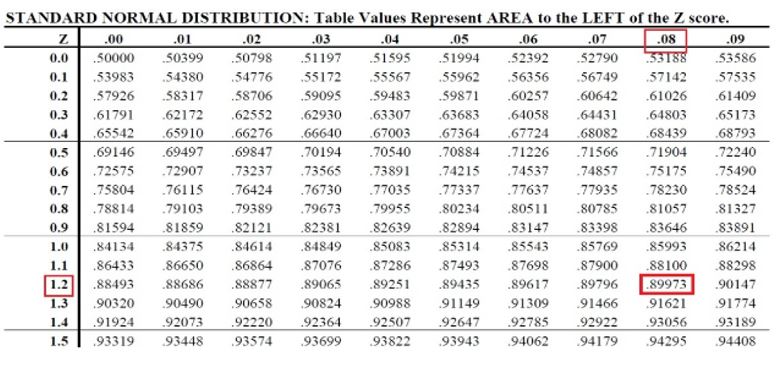
3. The value is .89973, which means that the percentage of values less than 1.28 is 89.97%
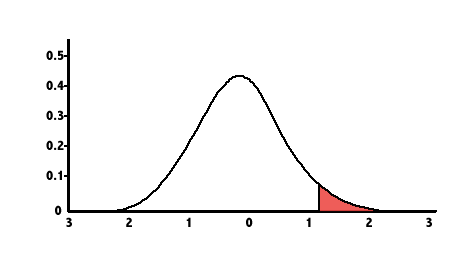
Example 2: Finding the percentage of values to the right of a Z-value
In a standard normal distribution, what percentage of values will be above 1.28?
1. Draw a diagram: in this example, you are looking for the percentage of values to the right of 1.28.

2. As the table only gives us values to the left of a Z score, we will use the percentage of values to the left of 1.28 that we found in the previous example:
- We know that 89.97% of values are below 1.28.
- To calculate the percentage of values above 1.28: 100% (total) - 89.97% = 10.03%
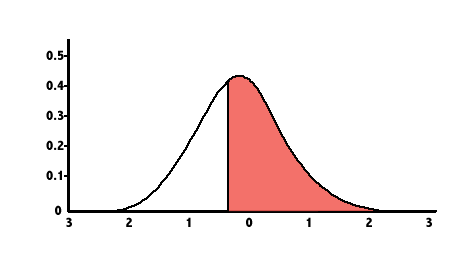
Example 3: Finding the percentage of values between the mean and a particular Z-score
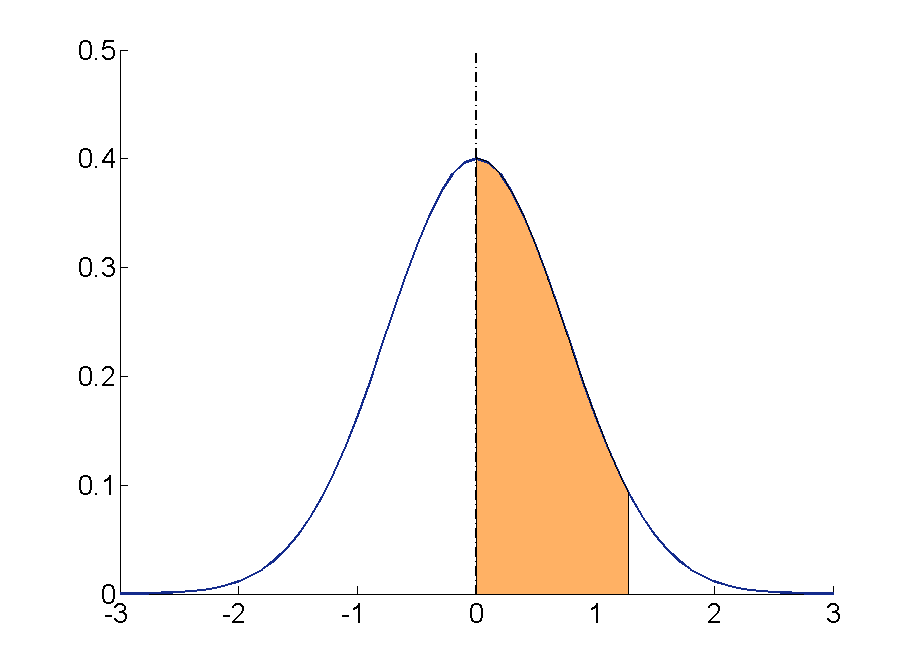
What percentage of values are between 0 and 1.28?
1. First draw a diagram: in this case, you are looking for values between the mean (0) and 1.28.
2. Since we can't find areas between two values in the standard normal table, we will use the information we know about the values that are to the left of 1.28:
- 89.97% of values are below 1.28
- The curve is symmetrical, which means that 50% of values lie above the mean and 50% of values lie below the mean
- 89.97% - 50% = 39.97%
Example 4: Finding the percentage of values between two Z-scores
What percentage of values will lie between -1.28 and 1.28?
1. Draw a diagram: in this example, you are looking for the percentage between a negative and a positive score.
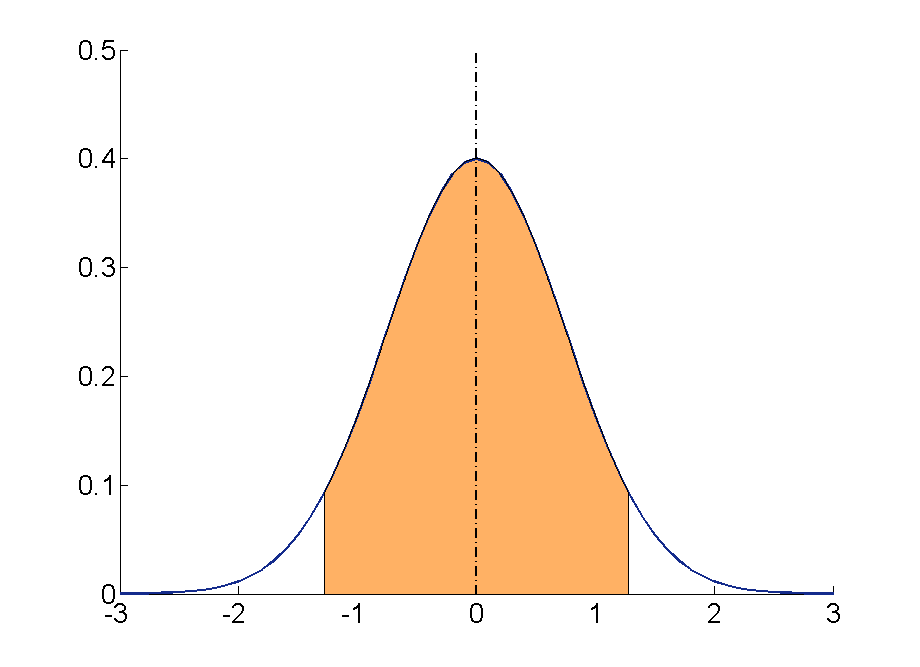
2. The curve is symmetrical. This means that the area between 0 and 1.28 is the same as the area between 0 and -1.28.
3. The percentage of values between 0 and 1.28 is 39.97% (found in example 3). Thus, we will have to multiply 39.97% x 2 = 79.98%
Example 5: Finding Z-scores and raw scores from percentages using the normal curve table.
The table can also be used to find Z-scores and raw scores from specific percentages.
For example, to find the Z-score from the percentage 90%, we look for the most approximate percentage in the table: .8997. Working backwards we see that this figure corresponds to a Z-score of 1.28.
This Z-score can then be converted to a raw score using the mean and the standard deviation of the distribution.